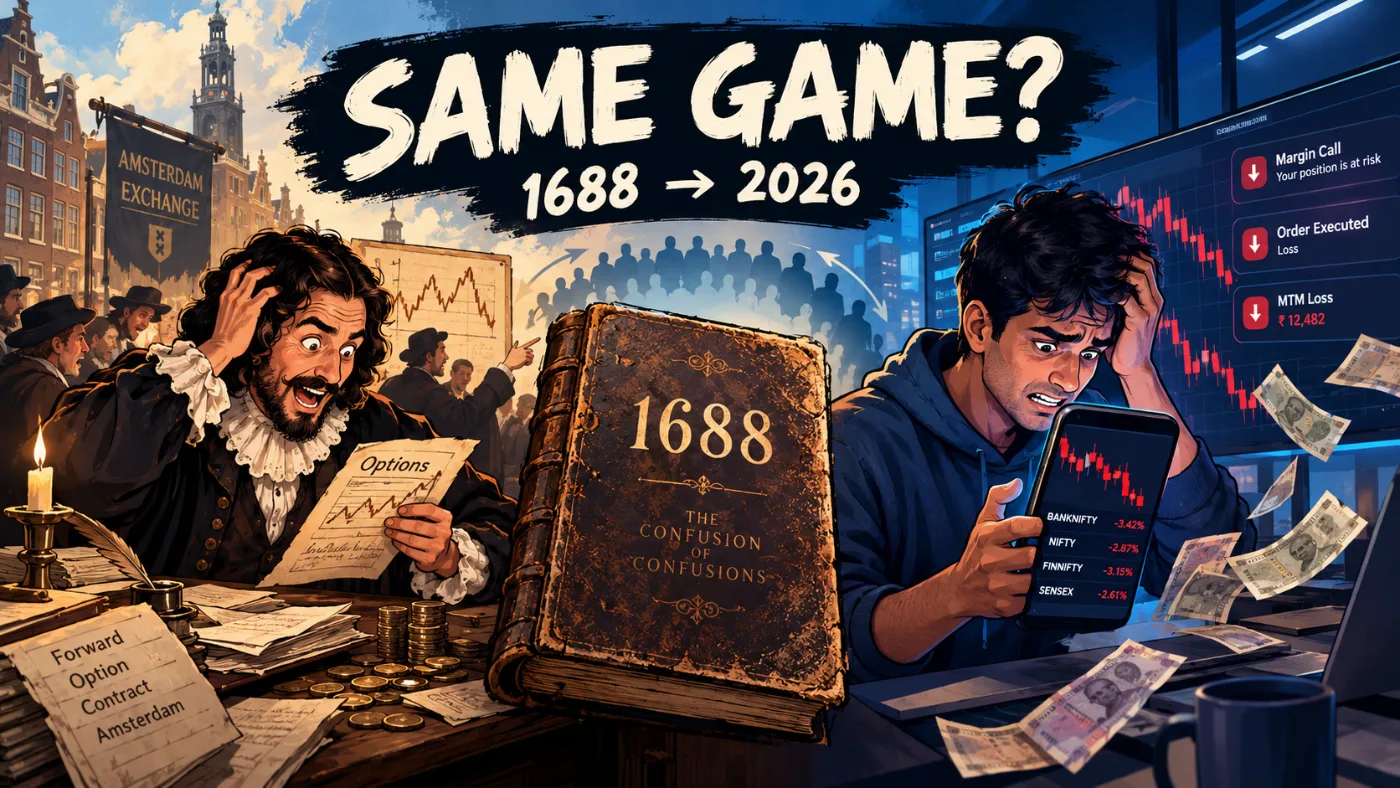
SEBI's study of individual trading outcomes in equity Futures & Options, published on 23 September 2024, found that 92.8% of individual traders recorded a net loss between FY22 and FY24 — the figure usually quoted as 93%. On a base of 1.13 crore unique individual traders, 1.05 crore finished the three years down. Aggregate net losses came to ₹1,81,383 crore inclusive of transaction costs, the ₹1.81 lakh crore in the headlines, an average of about ₹2.0 lakh for each loss-making trader.
Those are the stated figures. Divided out, they describe something more legible than a headline percentage — and something considerably older than the technology usually blamed for it.
The FY22–24 study is the one this piece takes apart, but it is no longer the latest. On 20 August 2026 SEBI published two further studies covering FY25 and FY26 (Press Release No. 50/2026), one on profitability and one on trading behaviour. In SEBI's broker sample, which covers about 90% of individual traders, active traders fell about 20%, from 98.1 lakh in FY25 to 78.6 lakh in FY26, and new entrants fell about 40%; SEBI's own summary puts the full FY26 count at 87.5 lakh.
Aggregate net losses declined to ₹91,685 crore in FY26 from about ₹1.12 lakh crore in FY25. The loss rate came down and stayed high: 87.7% of individual traders still lost money in FY26, the average net loss per trader edged up to about ₹1.17 lakh, and roughly 92% of aggregate losses arose in options. SEBI's July 2025 study, on a 13-broker sample, had put FY25 at ₹1,05,603 crore; the ₹1.12 lakh crore figure is the 2026 study's, on its 15-broker sample.
The arithmetic below is FY22–24 arithmetic. The pattern it describes has not gone anywhere.
What does ₹1.8 lakh crore actually work out to?


Show the full table — 11 rowsHide the full table
| The SEBI study, FY22–FY24 | Figure | Basis |
|---|---|---|
| Individual F&O traders recording a net loss | 92.8% | stated |
| Unique individual traders, FY22–24 | 1.13 crore | stated |
| Of whom loss-making | 1.05 crore | stated |
| Gross trading loss, before costs | ₹1,31,903 cr | stated |
| Transaction costs paid | ₹49,480 cr | stated |
| Aggregate net loss over three years | ₹1,81,383 cr | stated |
| Net loss by year: FY22 · FY23 · FY24 | ₹40,824 · ₹65,747 · ₹74,812 cr | stated |
| Average net loss per loss-making trader | ≈₹2.0 lakh | stated |
| FY24 traders aged under 30 | 43% | stated |
| Net loss per trading day, FY22–24 | ≈₹244 cr | derived: ₹1,81,383 cr ÷ 743 NSE sessions |
| Net loss per trading day, FY22 → FY24 | ≈₹165 → ≈₹304 cr | derived: each year's loss ÷ its sessions |
The table and chart above show SEBI's stated figures alongside our derived ones. The stated lines do most of the work. SEBI counts 1.13 crore unique individual traders over the three years, of whom 1.05 crore finished with a net loss. Spread across the NSE calendar, 743 sessions over the three years including the short muhurat and special weekend sessions (738 without them), the aggregate works out to roughly ₹244 crore of net individual loss per trading day, every trading day, for three years. That figure is ours, not SEBI's, and the session count moves it within about ₹244–246 crore.
The average hides an acceleration. SEBI's year-by-year table puts individuals' net loss at ₹40,824 crore in FY22, ₹65,747 crore in FY23 and ₹74,812 crore in FY24. That is about ₹165 crore a trading day in the first year and about ₹304 crore in the third. [Daily rates derived from SEBI figures and NSE trading calendars]
Within each year the line is still a simplification. Losses of this kind arrive unevenly, clustered around expiries and volatility. Drawn this way, though, the figure stops being an abstraction: a daily transfer that grew from about ₹165 crore to about ₹304 crore in two years, while the number of individual traders nearly doubled.
It is tempting to divide ₹1.81 lakh crore by the ₹2.0 lakh average and call the answer a headcount. It isn't one. The aggregate is a net figure across all individual traders: in SEBI's own split, 1.05 crore loss-makers lost ₹2,06,404 crore between them and 8.1 lakh profit-makers made ₹25,020 crore, which nets to ₹1.81 lakh crore. The ₹2.0 lakh is an average across loss-makers only. Dividing one by the other mixes two populations and lands about 14 lakh accounts short: 90.7 lakh, against 105.1 lakh. SEBI states both numbers directly, so there is nothing to infer. [Headcount check derived from SEBI figures]
The other side of the arithmetic is the 7.2%. About one trader in fourteen came out of three years without a net loss — and that group includes everyone who traded once, won, and stopped. Only about 1% cleared a profit of more than ₹1 lakh after costs. The losses were concentrated too: about 4 lakh traders, the worst 3.5% of loss-makers, accounted for 55.3% of all losses, at an average of ₹28 lakh each.
Who was on the other side of those trades?
The same SEBI study answers this, and the answer is unusually clean. In FY24, proprietary trading desksiFirms trading with their own capital rather than clients' money, typically with automated systems and direct exchange connectivity. recorded gross trading profits of about ₹33,000 crore and foreign portfolio investorsiOverseas institutions registered with SEBI to invest in Indian securities. In the derivatives context, largely systematic and arbitrage strategies. about ₹28,000 crore, both before transaction costs; domestic institutions added about ₹200 crore. Against them, individuals and others lost more than ₹61,000 crore in the same year, also before costs: about ₹41,500 crore in the individual category and about ₹19,700 crore in ‘others’, mostly corporates, trusts, NRIs and PMS clients. Almost all of the professional side was automated: 97% of the FPI profit and 96% of the proprietary profit came from algorithmic entities. [Source: SEBI, Press Release No. 22/2024 and the FY22–FY24 study, 23 September 2024]


Show the full table — 7 rowsHide the full table
| FY24 gross trading P&L, NSE F&O | ₹ crore | Who is in the category |
|---|---|---|
| Proprietary traders | +33,000 | Trading members trading on their own books |
| Foreign portfolio investors | +28,000 | FPIs, FVCIs, QFIs |
| Domestic institutional investors | +200 | Mutual funds, banks, insurers, NBFCs, AIFs |
| Profit side, combined | +61,200 | |
| Individuals | −41,500 | Individuals, HUFs, proprietorships, partnerships, LLPs |
| Others | −19,700 | Corporates, trusts, NRIs, PMS clients |
| Loss side, combined | −61,200 |
Those two numbers are one number. Before costs, exchange-traded derivatives are zero-sum: every rupee of gross profit booked by one category of participant is a rupee of gross loss booked by another. The ₹61,000 crore on the professional side is not a coincidence that happens to line up with the losing side. It is the losing side, individuals plus ‘others’, read from the other end of the trade.
SEBI's FY26 ledger, published in August 2026, is cleaner still, because individuals now stand alone on the losing side. Proprietary traders booked about ₹44,000 crore of gross trading profit, FPIs ₹14,000 crore, corporates ₹8,000 crore, mutual funds ₹3,000 crore and partnership firms and LLPs ₹3,000 crore: about ₹72,000 crore in all. Individuals' gross trading loss was about ₹72,000 crore. The automated share rose as well, with 99% of FPI and proprietary profit coming from algo entities. [Source: SEBI, Profitability of Individual Traders in the Equity Derivatives Segment (FY25–FY26), 20 August 2026]


Show the full table — 7 rowsHide the full table
| FY26 gross trading P&L | ₹ crore | Basis |
|---|---|---|
| Proprietary traders | +44,000 | stated; includes foreign-owned TM-proprietary entities |
| Foreign portfolio investors | +14,000 | stated |
| Corporates | +8,000 | stated |
| Mutual funds | +3,000 | stated |
| Partnership firms / LLPs | +3,000 | stated |
| Profit side, combined | +72,000 | derived: sum of the rows above |
| Individuals | −72,000 | stated |
What the gross figure leaves out is the money that leaves the market altogether. On SEBI's broker-sample basis, individuals' FY24 gross trading loss was ₹52,361 crore, and transaction costs of ₹22,451 crore (brokerage, exchange fees, securities transaction tax, GST and stamp duty) took the net loss to ₹74,812 crore. The ₹41,500 crore above comes from exchange-wide NSE data, and SEBI says the two bases are not strictly comparable, so the gap between them is a data difference, not a cost line. Across FY22–24, individuals paid ₹49,480 crore in transaction costs, more than a quarter of their net loss. About half of that was brokerage; ₹13,800 crore went to the government and ₹10,200 crore to the exchanges. In FY24 alone, costs came to roughly ₹26,000 per trader. SEBI's 2026 study puts the cumulative total for FY22–FY26 at roughly ₹1 lakh crore. The counterparty takes the trading loss. The intermediaries and the exchequer take the rest.
A derivatives market does not create returns. It relocates them. SEBI's loss rate and its category ledger are the same fact read from two ends.
If the pattern predates the exchange, what exactly is the app to blame for?
The scale of these losses is usually attributed to contemporary factors — leverage availability, options-market accessibility, trading-app design, social-media-driven sentiment. Each is plausible as an amplifier. None of them is old enough to be the origin.
In 1688, Joseph de la Vega, a Sephardic Jewish merchant and writer in Amsterdam's Portuguese Jewish community, published Confusion of Confusions, written in Spanish and printed in Amsterdam, and generally regarded as the earliest known descriptive account of stock-exchange trading. It covers the Amsterdam market in shares of the Dutch East India Company, and appeared in the year that market crashed. The text describes "opsies"iThe Dutch term, from the Latin optio (“choice”), that de la Vega uses inside his Spanish text for early call and put option contracts: the right, but not the obligation, to buy or sell a share at a set price. — early call and put option contracts — together with forward contracts settled on fixed days each month and short selling, used predominantly for speculative rather than hedging purposes.
The instruments are the less interesting half. What de la Vega actually catalogues is behaviour: overconfidence following favourable outcomes, susceptibility to rumour, herd behaviour, and fear-driven decision-making. SEBI's studies record outcomes and, since August 2026, trading behaviour (how often people trade, how close to expiry, how long they persist after losing), but not states of mind. So the comparison below runs between de la Vega's descriptions and today's instruments, not between two sets of findings.
| Amsterdam, 1688 | Mumbai, 2026 — the modern analogue |
|---|---|
| Options ("opsies") on Dutch East India Company shares | Weekly index options, traded mostly on expiry day, via a mobile app |
| Overconfidence following consecutive favourable trades | Overconfidence following consecutive favourable trades |
| Pursuit of a rumour-driven price move | Pursuit of a rumour-driven price move |
| Attribution of favourable outcomes to skill rather than chance | Attribution of favourable outcomes to skill rather than chance |
| Forward contracts and short selling, used predominantly to speculate | Futures and leveraged intraday positions, used predominantly to speculate |
The right-hand column maps de la Vega onto current instruments; it is not a list of SEBI findings. What SEBI does record is behaviour at the level of the trade. In FY22–24, 76.3% of traders who had lost two years running kept going, and only 8.3% of them made a profit in the third year. In the FY25–FY26 study, about 90% of such persisters lost again, about 59% of index-options turnover was in contracts expiring that same day, and 79% of traders with both winning and losing quarters had average gains smaller than their average losses.
Confusion of Confusions was published 338 years before this note. It predates the New York Stock Exchange by 104 years — dating that exchange to the Buttonwood Agreement of 1792 — and the Bombay Stock Exchange, founded in 1875, by 187.
Every technology commonly blamed for retail derivatives losses — the smartphone, the discount broker, the weekly expiry, the algorithm — postdates the written description of the behaviour by more than three centuries.
So what has actually changed?
Four things, and it is worth being precise about which:
-
a)
Speed of execution, and the cost of doing it often. A forward trade in de la Vega's Amsterdam was struck in person and settled on fixed days each month. A position today opens from a phone in under a second. The friction between an impulse and a position has gone almost entirely, but the cost of repeating it has not: individuals paid about ₹1 lakh crore in transaction costs over FY22–FY26.
-
b)
Product sophistication. An opsie on a single company's shares and a weekly index option are the same instrument class, but the second offers far more leverage per rupee committed and expires far more often, which multiplies the number of decisions a trader makes in a year. In FY26, about 59% of index-options turnover was in contracts on their last day of life.
-
c)
The counterparty. The professional on the other side of a 1688 trade was another merchant. Today it is, with high probability, a systematic desk with lower latency, better pricing and no emotional exposure to the outcome; 99% of FPI and proprietary gross profit in FY26 came from algo entities. This is the change with the clearest link to the loss figures.
-
d)
The rules around the product. Between November 2024 and February 2025 SEBI tripled the minimum index-derivative contract size to ₹15 lakh, cut weekly expiries to one benchmark index per exchange, required option premiums to be collected upfront, and removed the calendar-spread margin benefit on expiry day. STT on options premium rose in October 2024 and again on 1 April 2026, to 0.15%. FY26 was the first full year under the SEBI measures: participation fell by about a fifth, new entrants by about 40%, and the loss rate moved from about 91% to 87.7%. How the expiry price itself is set is now under review too.
What has not changed, on the evidence of both records, is the behavioural input: overconfidence after a run of wins, chasing a rumour, and reading a favourable outcome as skill. SEBI's FY25–FY26 behaviour study adds a telling detail: traders with several consecutive years in the segment lost at rates similar to everyone else. Information, technology and the rulebook have all moved across 338 years. Individual trading behaviour has not moved at the same rate.
The 43% figure is where this lands hardest. More than two in five of FY24's individual traders were under 30, up from 31% a year earlier, and about 93% of them lost money against 91.1% of individual traders overall that year. SEBI's 2026 study found younger and lower-income traders trading far more intensively relative to their resources, and trading intensity was among the strongest correlates of loss. They are trading a product whose failure modes were written down, in detail, in Spanish, in 1688. The information problem was solved three centuries ago. The behavioural one is still open.